

A bigger loan total can suggest that an industry is gaining ground, but it doesn't always mean more businesses are getting funded. Across industries commonly associated with surety bond requirements, some of the largest increases in SBA lending came from just a handful of loans. Contractors stood out for a different reason: growth reached loan dollars, loan counts, and jobs supported.
To see where that momentum was building, we analyzed U.S. Small Business Administration 7(a) lending and Surety Bond Guarantee program data, comparing 2022 with 2025. We examined lending across seven bonded business categories, then looked at changes in surety bond dollar volume within construction trades. The findings show where activity expanded and why the biggest percentages need a closer look.
Key Takeaways
- Contractors are the only bonded business category to post growth in SBA loan volume, loan count, and jobs supported between 2022 and 2025.
- Bond dollar volume declined for site preparation (-15%), plumbing/HVAC (-18%), and industrial building construction (-20.2%).
- Notaries/title services posted the largest dollar-volume increase of any bonded category studied, up 315.6% from 2022 to 2025, but the number of SBA loans issued to the category fell 40%, from five to three.
- Framing contractors led the construction trades analyzed with a 426.4% increase in SBA surety bond dollar volume.
- Jobs supported by SBA 7(a) loans to mortgage and lending businesses fell 95.1%, the largest decline among the categories studied.
Changing Loan Activity Across Bonded Businesses
Contractors had the broadest gains across the three lending measures. Other categories showed how rising dollar totals can sit alongside fewer loans or fewer jobs supported.
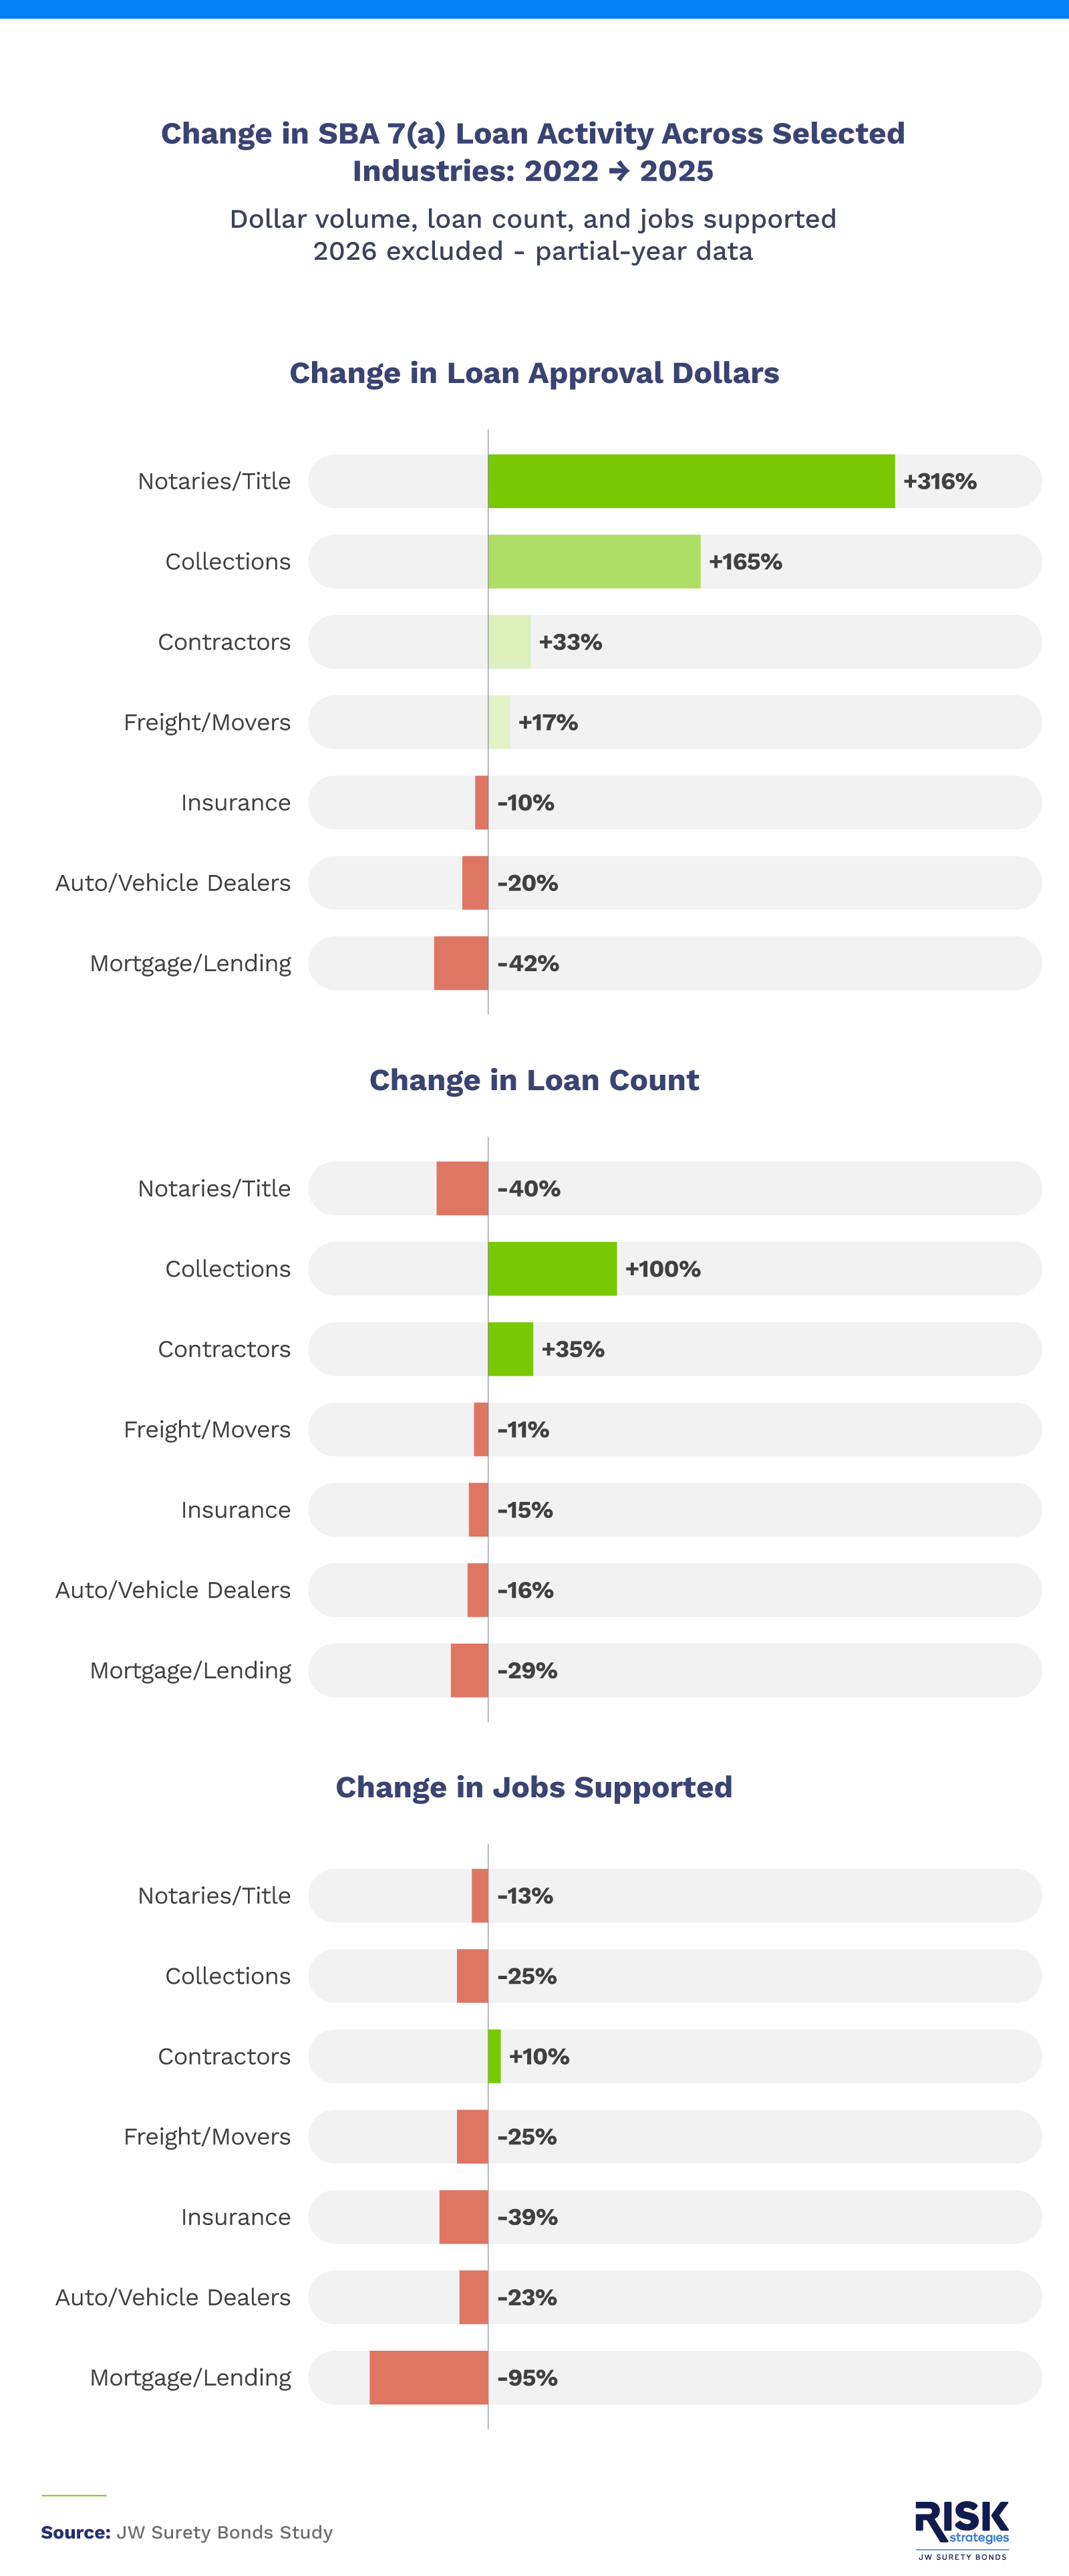
SBA 7(a) loan dollar volume to contractors rose 33%, from $409.1 million in 2022 to $544.2 million in 2025. Loan count grew at a similar pace, increasing 34.8%, from 1,436 to 1,936. That combination points to an expansion in lending activity across more loans, rather than a dollar increase concentrated in fewer transactions.
Jobs supported by those loans also increased, rising 10.4%, from 9,749 to 10,762. Contractors were the only category studied to post a gain in this measure. Every other category recorded a decline, with mortgage and lending businesses seeing the steepest drop at 95.1%.
The largest dollar-volume increase belonged to notaries and title services, at 315.6%. Yet the number of loans in that category fell 40%, from five to three. More money flowed through fewer loans, making this a different kind of growth from the broader increase seen among contractors.
Collection agencies recorded the second-largest dollar-volume gain, at 165.2%, while loan count doubled from two to four. Both collections and notaries/title services started with very few loans, so even a small change in transactions could move their percentages sharply. Those gains offer a signal of shifting activity, but limited evidence of an industry-wide surge.
Three categories saw loan dollar volume fall outright: mortgage and lending businesses (-42.5%), auto and vehicle dealers (-20.1%), and insurance businesses (-10%). Together, the results show an uneven funding picture. Contractors gained across all three measures, while other categories either contracted or posted increases that did not extend to jobs supported.
Bond Growth Inside Contracting
The separate SBA Surety Bond Guarantee program offers another view of contractor activity. Within that program, several structural construction trades recorded substantial dollar-volume gains, while others moved backward.
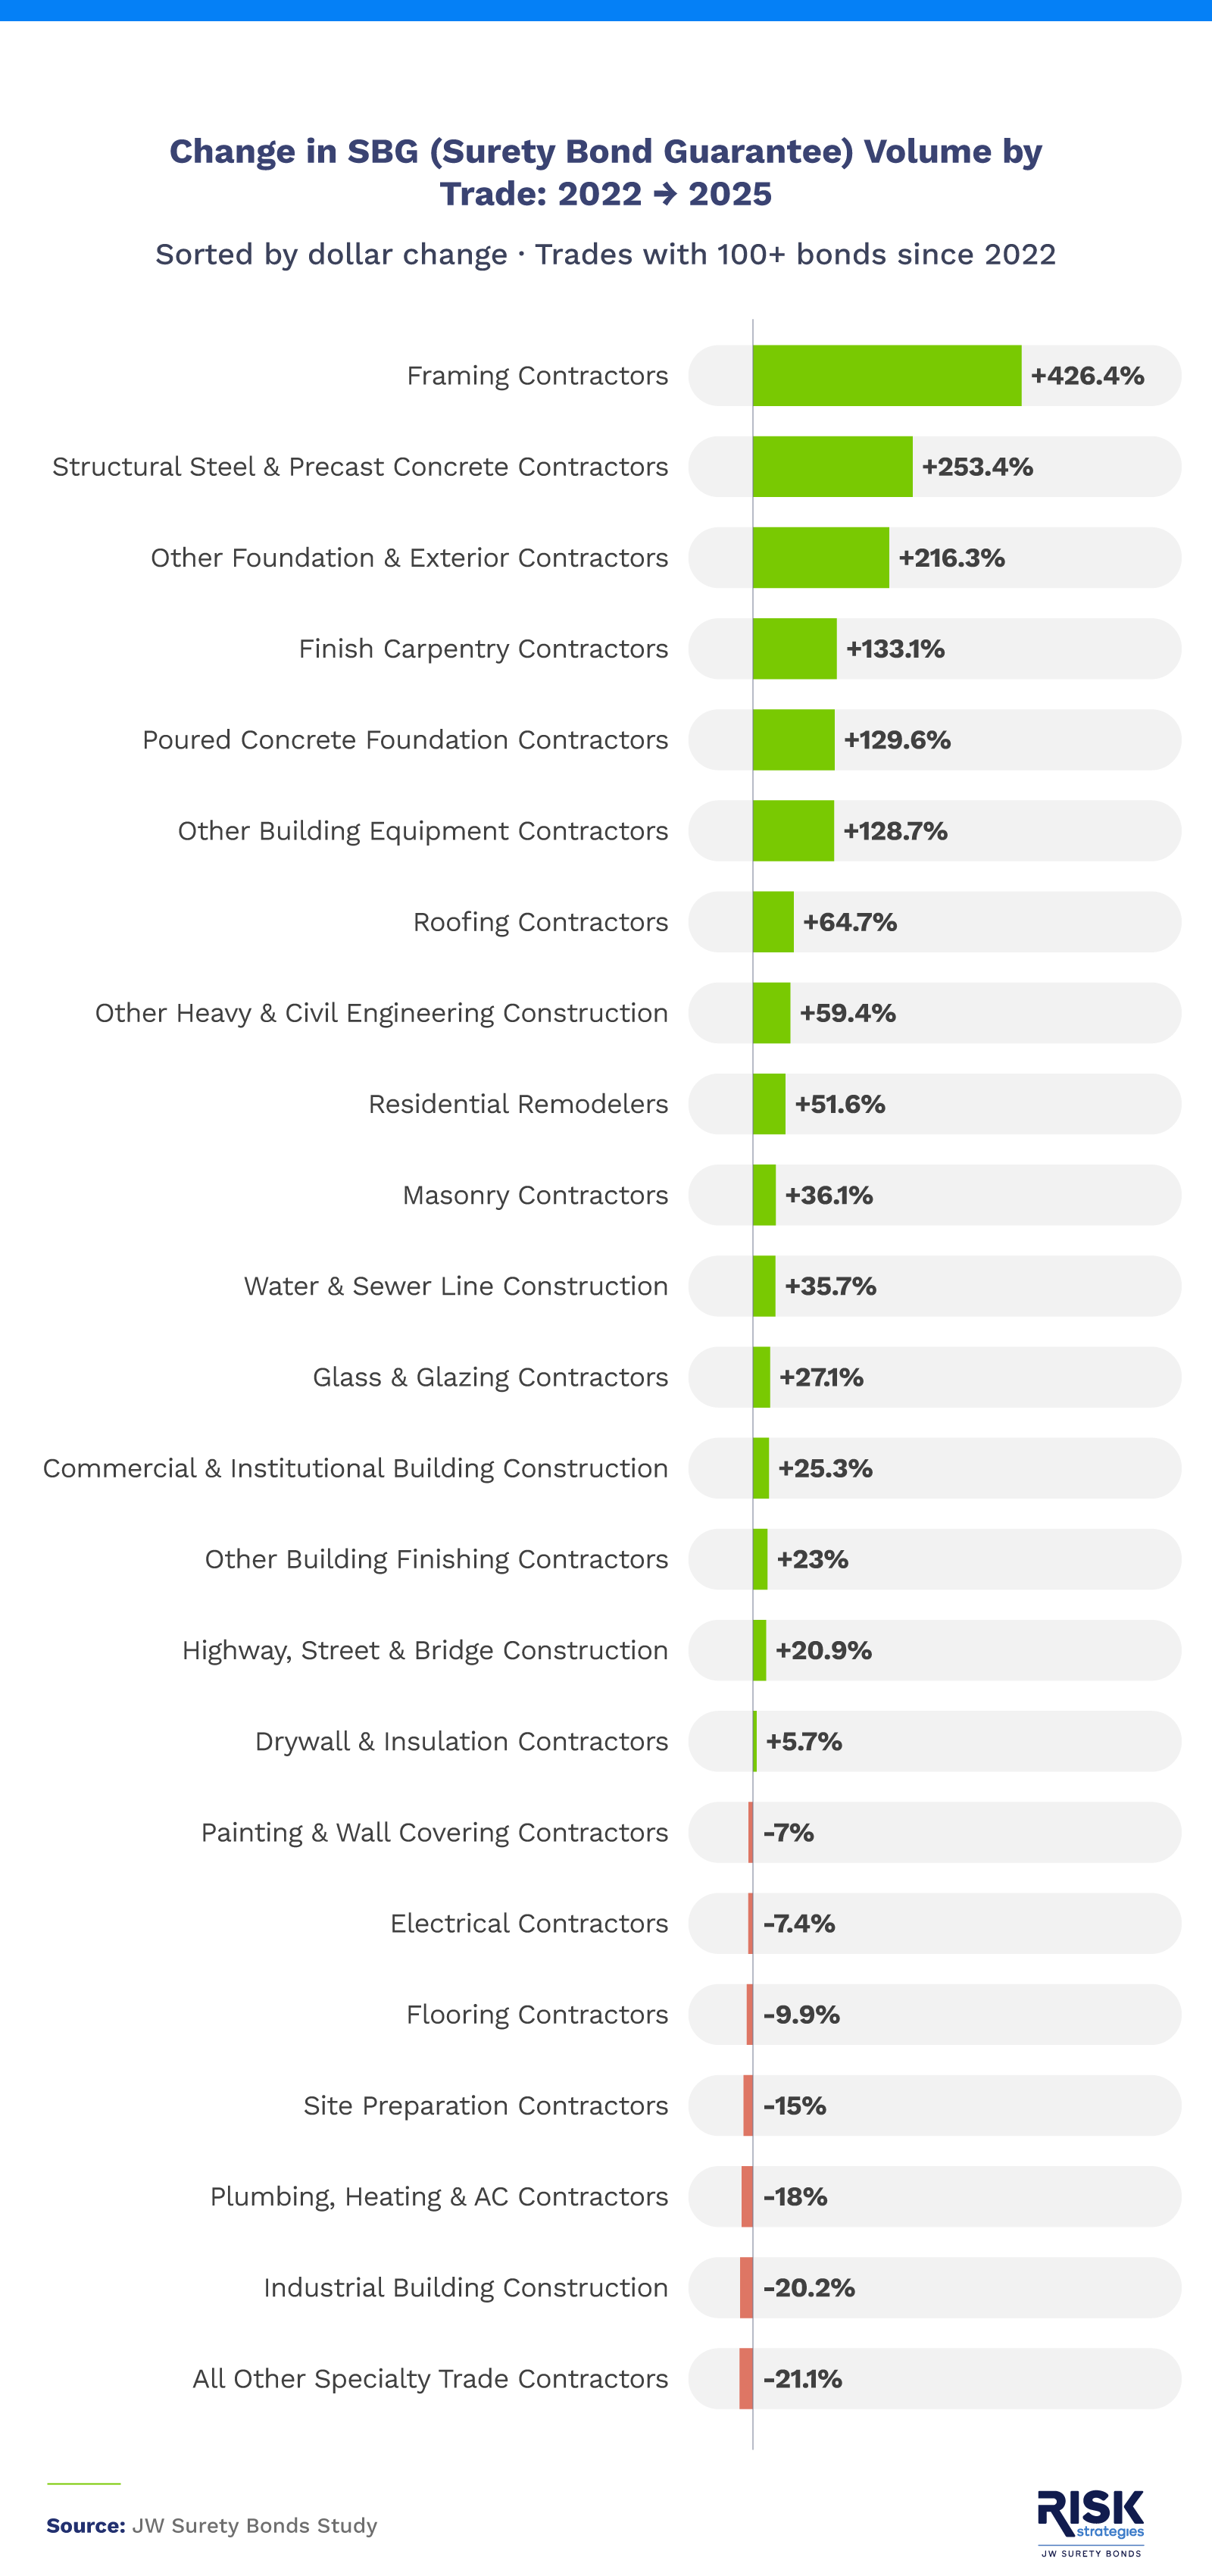
Framing contractors posted the largest increase among the trades analyzed, with surety bond dollar volume up 426.4% between 2022 and 2025. Structural steel and precast concrete contractors followed at 253.4%, while other foundation and exterior contractors recorded a 216.3% gain. All three more than tripled their 2022 dollar volume.
The gains were not shared across every part of construction. Site preparation contractors saw bond dollar volume fall 15%, plumbing and HVAC contractors recorded an 18% decline, and industrial building construction dropped 20.2%. Those decreases show why the broader contractor trend needs a trade-level view: growth across the category can coexist with falling activity in individual specialties.
These figures describe changes in surety bond dollar volume within the SBA program. They do not establish that the same changes occurred in contractor revenue, profitability, or the wider construction market. They also measure a different form of activity from 7(a) lending, so the two dollar totals should be read separately.
Reading the Momentum Beyond the Headline
Contractors showed the most consistent funding momentum among the seven categories studied, with gains in loan dollars, loan counts, and jobs supported. Within contracting, however, surety activity varied considerably by trade. For business owners assessing these trends, the useful question is how broadly growth extends across the measures, not simply which category has the largest percentage increase. Looking at transaction counts alongside dollar volume helps put that opportunity in perspective.
Methodology
To identify the industries seeing the strongest growth in bonded business activity, we analyzed two SBA datasets: 7(a) loan data and Surety Bond Guarantee (SBG) program data. The analysis compared activity in 2022 with activity in 2025. Partial-year 2026 data was excluded from change calculations.
For the lending analysis, SBA 7(a) records were grouped by North American Industry Classification System (NAICS) category into seven industries commonly associated with bonding requirements: contractors, freight and movers, insurance, auto and vehicle dealers, mortgage and lending, notaries and title services, and collections. We compared percentage changes in loan dollar volume, loan count, and jobs supported. References to the strongest or largest gains apply only to the categories analyzed and the specified measure; no composite ranking was used.
The construction trade analysis separately compared changes in SBA Surety Bond Guarantee dollar volume between 2022 and 2025. It included construction trades with more than 100 total bonds issued during that period.
The two programs measure different forms of activity: lending and surety guarantees. Their dollar volumes were not combined. Industry classifications identify categories commonly associated with bonding requirements; they do not establish that every business receiving a 7(a) loan held a surety bond.
Collections, mortgage/lending, and notaries/title had fewer than 10 loans per year in the underlying analysis. Changes involving one or two transactions can therefore produce large percentage swings, and these results should be treated as directional signals.
The findings reflect activity within the specified SBA programs rather than all financing or bonding across these industries. Jobs supported by program loans should not be interpreted as total industry employment or net new jobs created. The analysis does not establish why activity changed or measure business survival, revenue, or profitability.
About JW Surety Bonds
JW Surety Bonds provides surety bond solutions for contractors and business owners across the United States. From contractor license bonds to commercial bonds for other regulated professions, we help businesses meet bonding requirements and move forward with their work.
Fair Use Statement
You're welcome to share these findings for noncommercial purposes. Please link back to this report and credit JW Surety Bonds so readers can explore the full analysis.

Leave a Reply